Writing Custom Plotting Functions#
This page explains how to define custom plotting functions that can be passed to the plots() method of a Data object. For new users of PyTTOP or Python, the section on The simplest usage will generally suffice. For more experienced users, it is recommanded to read the Two ways to define plotting functions. For PyTTOP developers and advanced users seeking more control over plotting function behaviour, refer to Advanced customiztion of the plotting function behaviour.
The simplest usage#
You can simply define a function, and pass it to the plots() method:
from pyttop.table import Data
import matplotlib.pyplot as plt
import numpy as np
data = Data(name='data')
data['x'] = [1, 2, 3]
data['y'] = [2, 4, 7]
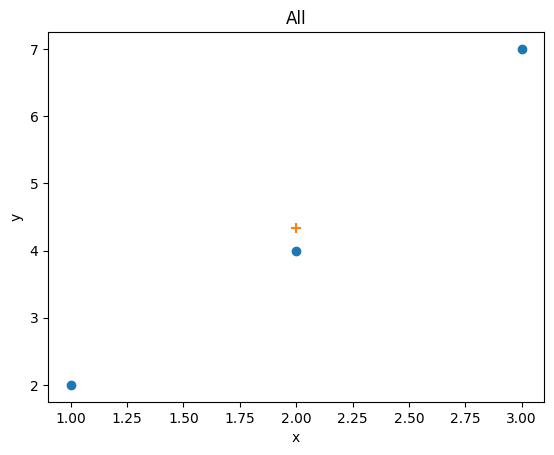
def scatter_and_mean(x, y, **kwargs):
plt.scatter(x, y, **kwargs)
plt.scatter(np.mean(x), np.mean(y), marker='+', s=60)
data.plot(
scatter_and_mean,
cols=('x', 'y'),
)
Caution
The automatic labels are generated by the Data’s plot() method, which cannot account for whatever operation is made within the plotting function. It is generally a good idea to double-check if the labels are correct, or to set them manually. For advanced usage, you can also customize the plotting function’s behaviour as described here.
Two ways to define plotting functions#
There are two common ways to create plots. The first is to directly call functions from plt:
plt.plot(x, y)
The second is to create an axis (or axes) and call the methods of the Axes object:
ax.plot(x, y)
A plotting function can be defined using either method, as demonstrated in the examples below. By default, PyTTOP will attempt to automatically determine how a plotting function is defined. However, it is recommanded to import plotFunc or plotFuncAx and use them to specify how a plotting function is defined:
from pyttop.plot import plotFunc, plotFuncAx

# method 1:
@plotFunc
def my_plot(x, y):
    plt.plot(x, y)

# method 2:
@plotFuncAx
def my_plot(ax):
    def plot(x, y):
        ax.plot(x, y)
    return plot
Advanced customiztion of a plotting function’s behaviour#
Automatic generation of axis labels#
The axis labels are automatically generated based on the values of the cols argument passed to the plots() method. For custom plotting functions, the default behaviour is to assign the first element of cols as the xlabel, the second (if any) as the ylabel, and the third (if any) as the zlabel. This is similar to performing the following operation:
cols = ('c1', 'c2') # the received `cols` argument
# treated as xlabel and ylabel
ax.set_xlabel('c1')
ax.set_ylabel('c2')
If a column label is set using set_label() (e.g., data.set_label(c1='Column 1')), the specified label will be used instead (e.g., 'Column 1' will be used in place of 'c1').
To customize how labels are generated based on cols, define a function that returns a dictionary of the labels, and assign it to the function’s configuration as shown in the example below:
@plotFunc
def my_plot_function(x, y):
    plt.scatter(x + y, y)

def label_generator(labels): # Takes the column labels, e.g., ('c1', 'c2')
    return {
        'xlabel': f'{labels[0]} + {labels[1]}', # e.g., 'c1 + c2'
        'ylabel': labels[1], # e.g., 'c2'
        # 'zlabel': <z label> # not relevant here
        }

my_plot_function.config['ax_label_kwargs_generator'] = label_generator